Objectives :
- Learn the fundamentals of Site Reliability Engineering
Site Reliability Engineering

The Problem
The traditional approach consists of having a team of sysadmins who are responsible for deploying the services in production and doing the maintenance.
As illustrated in the following diagram, 2 separate teams, the software team developing the applications, and the sysadmin teams, deploying and maintaining the application in production.
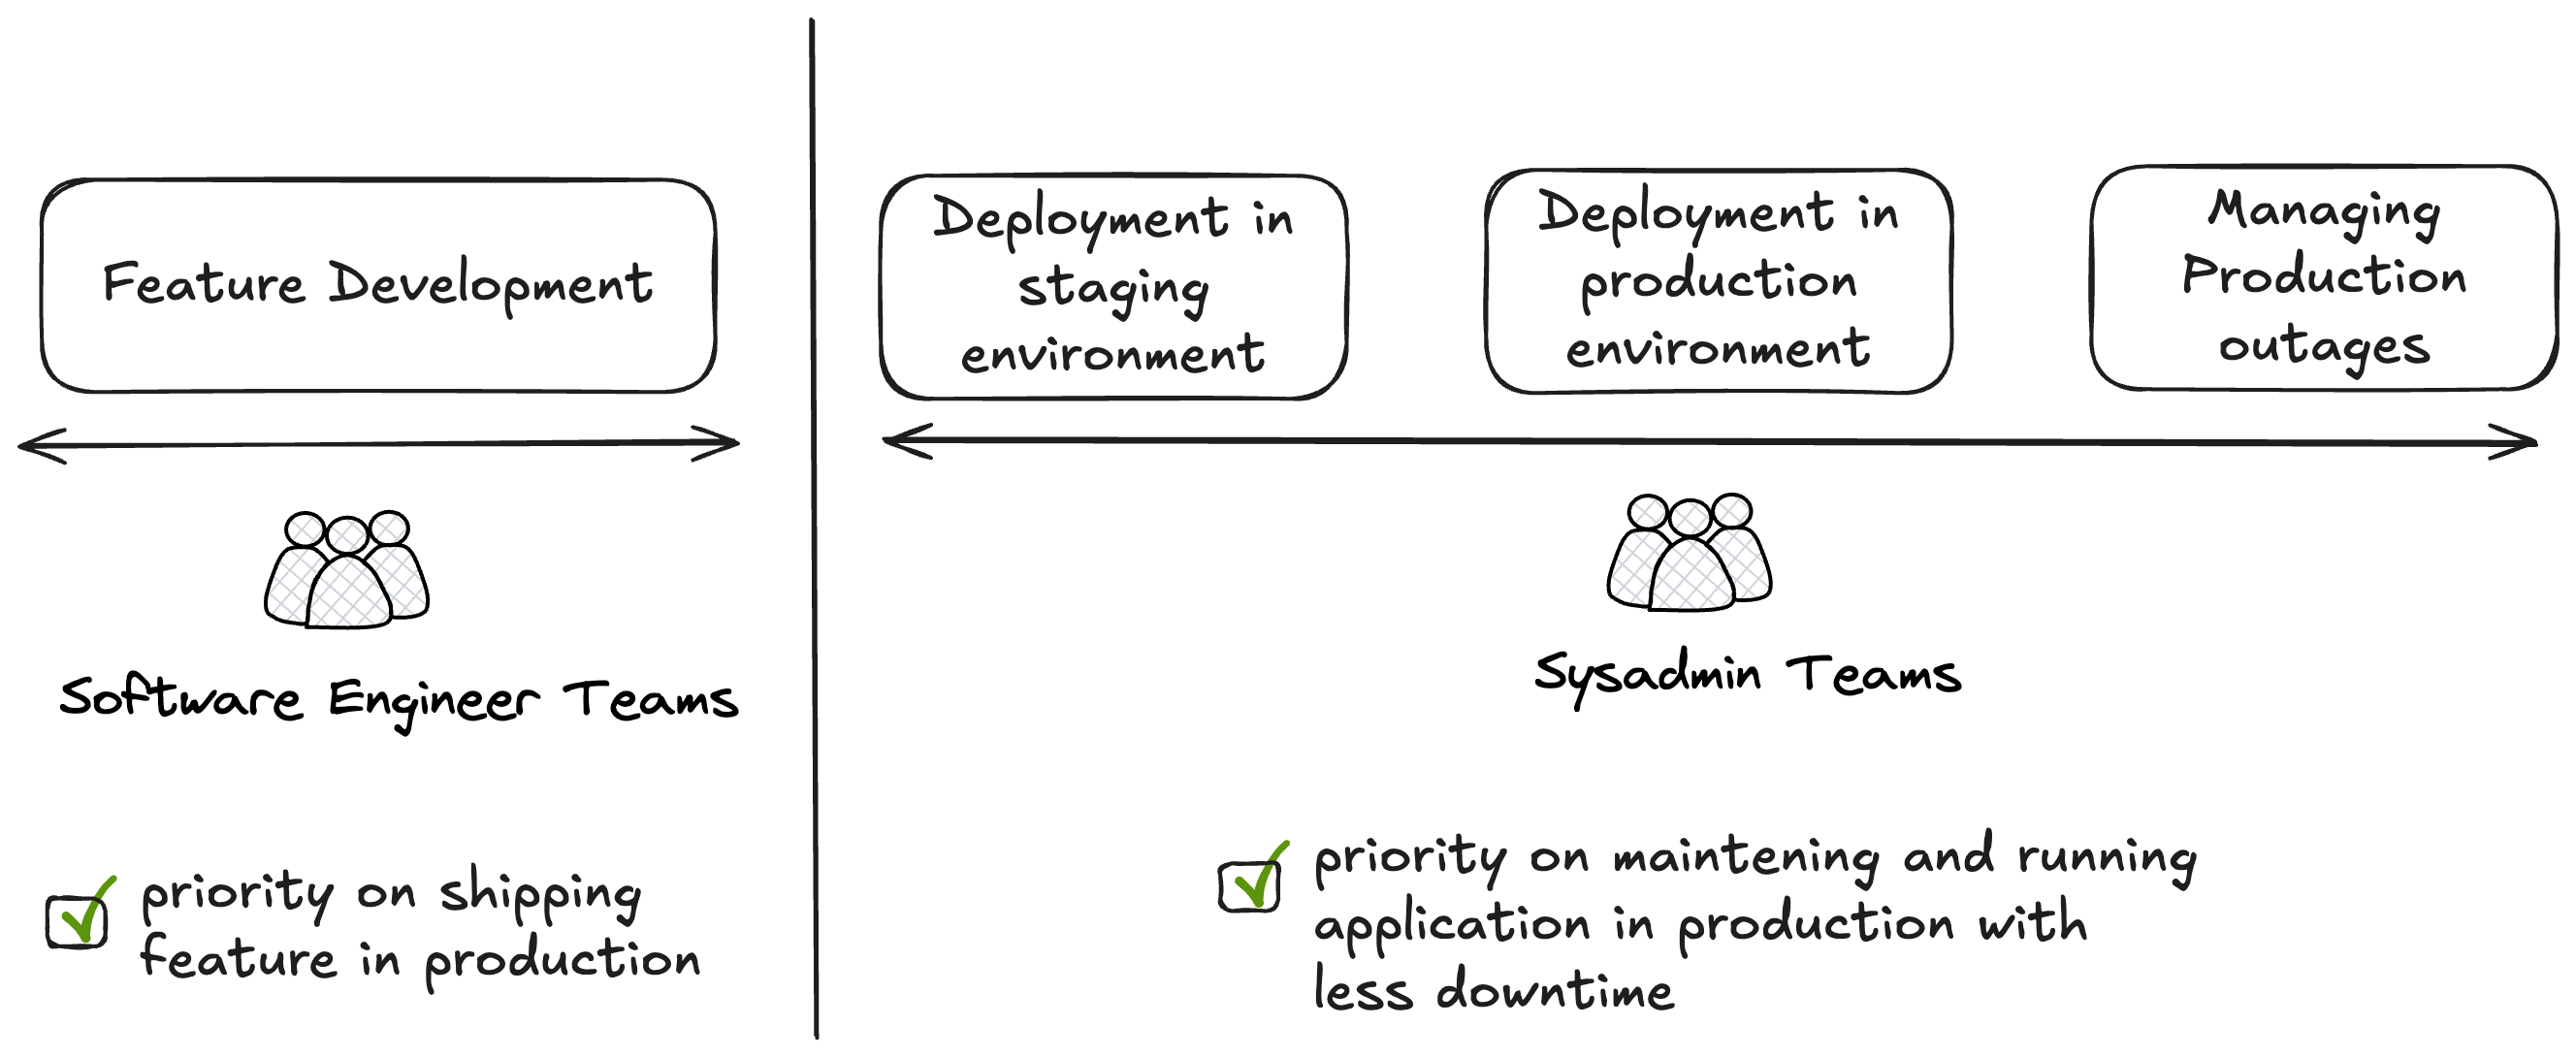
The problem with this approach, is that as more services are integrated or developed, the sysadmins team needs to grow exponentially, incurring an increase on direct costs.
And on the other hand, there is indirect cost at the organization level, most of the time, software teams and sysadmins teams have different objectives, priorities and use different terms to define the same event.
Google over the years, provided more and more services, and experienced directly the limitations of the traditional approach.
With the implementation of SRE Teams (Site Reliability Engineering), they were able to :
(1) : increase substantially the velocity of features/services deployed in production
(2) : improve the service reliability in production
SRE Principles
4 main principles govern the SRE model and describe how organization can implement them in their processes:
Embracing Risk
Service Level Objectives
Eliminating Toil
Monitoring Distributed Systems
Embracing Risks
Ideally your service is available all the time for your users. But unfortunately, sometimes you can experience unplanned downtime (failures, etc) or you may need to perform some updates (planned downtime).
So you can't really have a 100% service availability. What you can expect is having a number closer, generally the 5 nines: 99.9%, 99.99%, 99.999%.
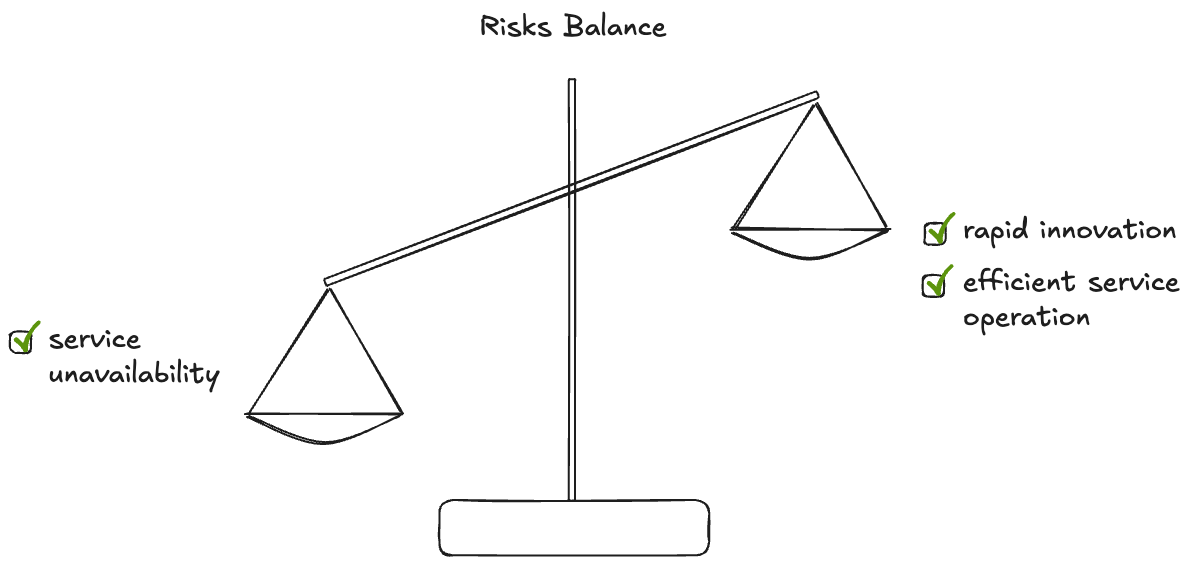
Experiences have shown that trying the reach absolutely the highest service availability cost you in terms of agility (less frequent updates, few features, etc..)
As illustrates in the following diagram the best way to improve your service overall cost is by balancing the risks, as illustrated in the following diagram :
The first step will be to measure the service risk, trying the get the uptime level. The best formula to calculate the availability of the service :
availability = successful requests / total requests
In a second step you can prioritize the impact of the services on your business (revenue). A service to free users, will for instance have less impact than a service offered to premium users.
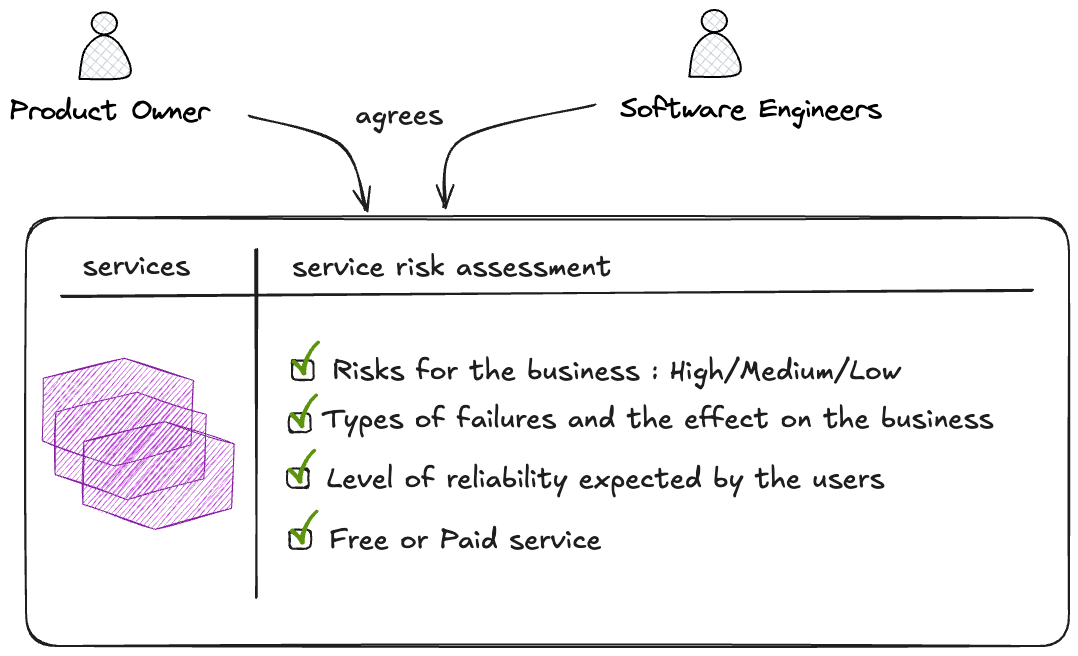
At a third step, you can define the target level of availability. As illustrated in the following diagram, to clearly define the service risks, product owners and software teams can agree on the impacts if the service is unavailable.
Below is a table including the availability level and corresponding unavailability window per year and per day to give you a good understanding.
| Availability Level | Allowed unavailability window (per/year) | Allowed unavailability window (per/day) |
|---|---|---|
| 90% | 36.5 days | 2.4 hours |
| 95% | 18.25 days | 1.2 hours |
| 99% | 3.65 days | 14.4 minutes |
| 99.9% | 8.76 hours | 7.20 minutes |
| 99.99% | 53.6 minutes | 1.44 minutes |
| 99.999% | 5.26 minutes | 43.2 seconds |
Let's understand it better with real use cases.
Use Case 1 : A service that serves 5 millions requests/day and has a target availability level of 99.9% per day, can tolerate up to 25000 errors (or failed requests) per day and still meets the service level target.
Use Case 2 : A service that serves 2 millions requests/day and has a target availability level of 99.99% per day, can tolerate up to 2000 errors (or failed requests) per day and still meets the service level target
Service Level Objectives
Additionally to the SLA (Service Level Agreement) which is an indicator more appropriate for the business requirements, SRE introduces 2 types of metrics to measure the service:
SLI (Service Level Indicator), which is a specific metric to measure the service
There are 2 categories of SLI metrics : User facing system and Storage.
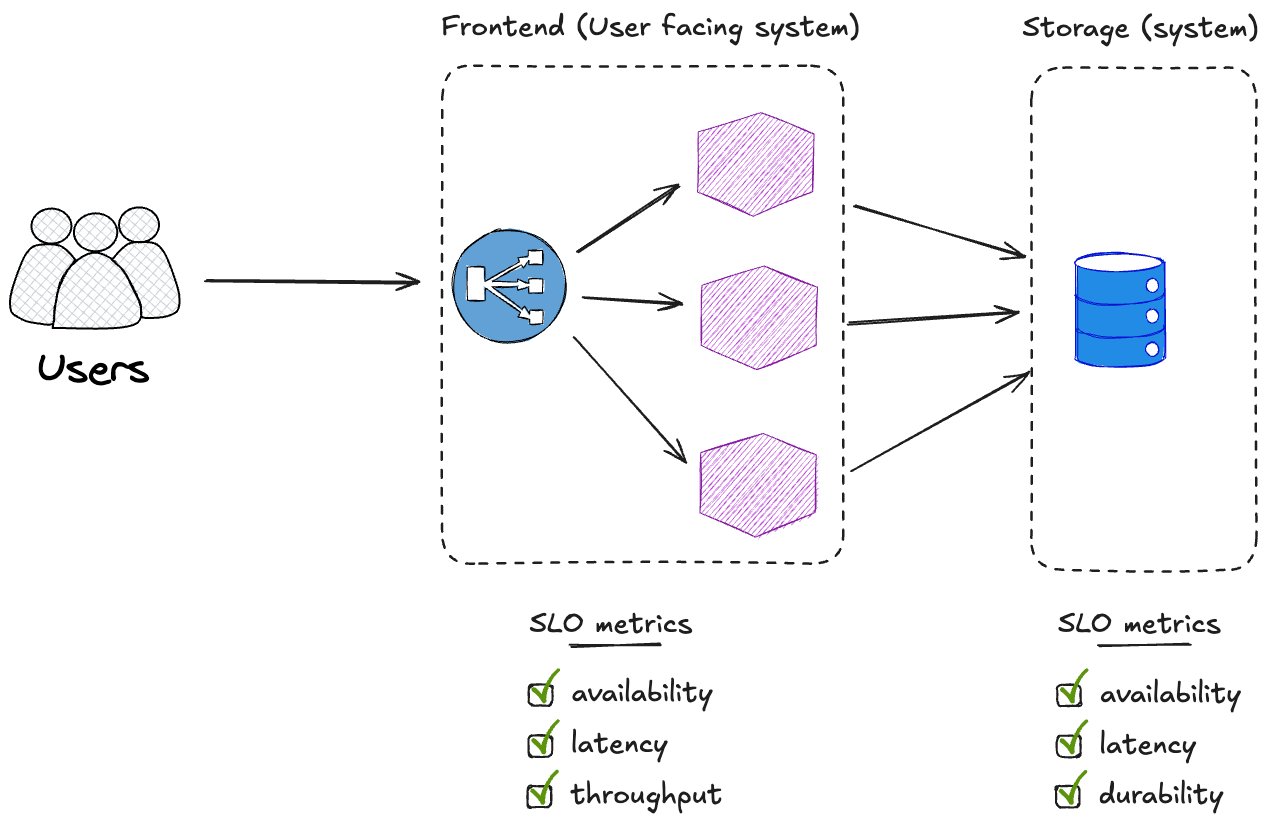
User facing system
the time it takes for the service to respond to a HTTP request (1ms, 100ms, 500ms)
the number of failed requests in proportion to all the requests (2% failed HTTP request per/s, 10%, ..)
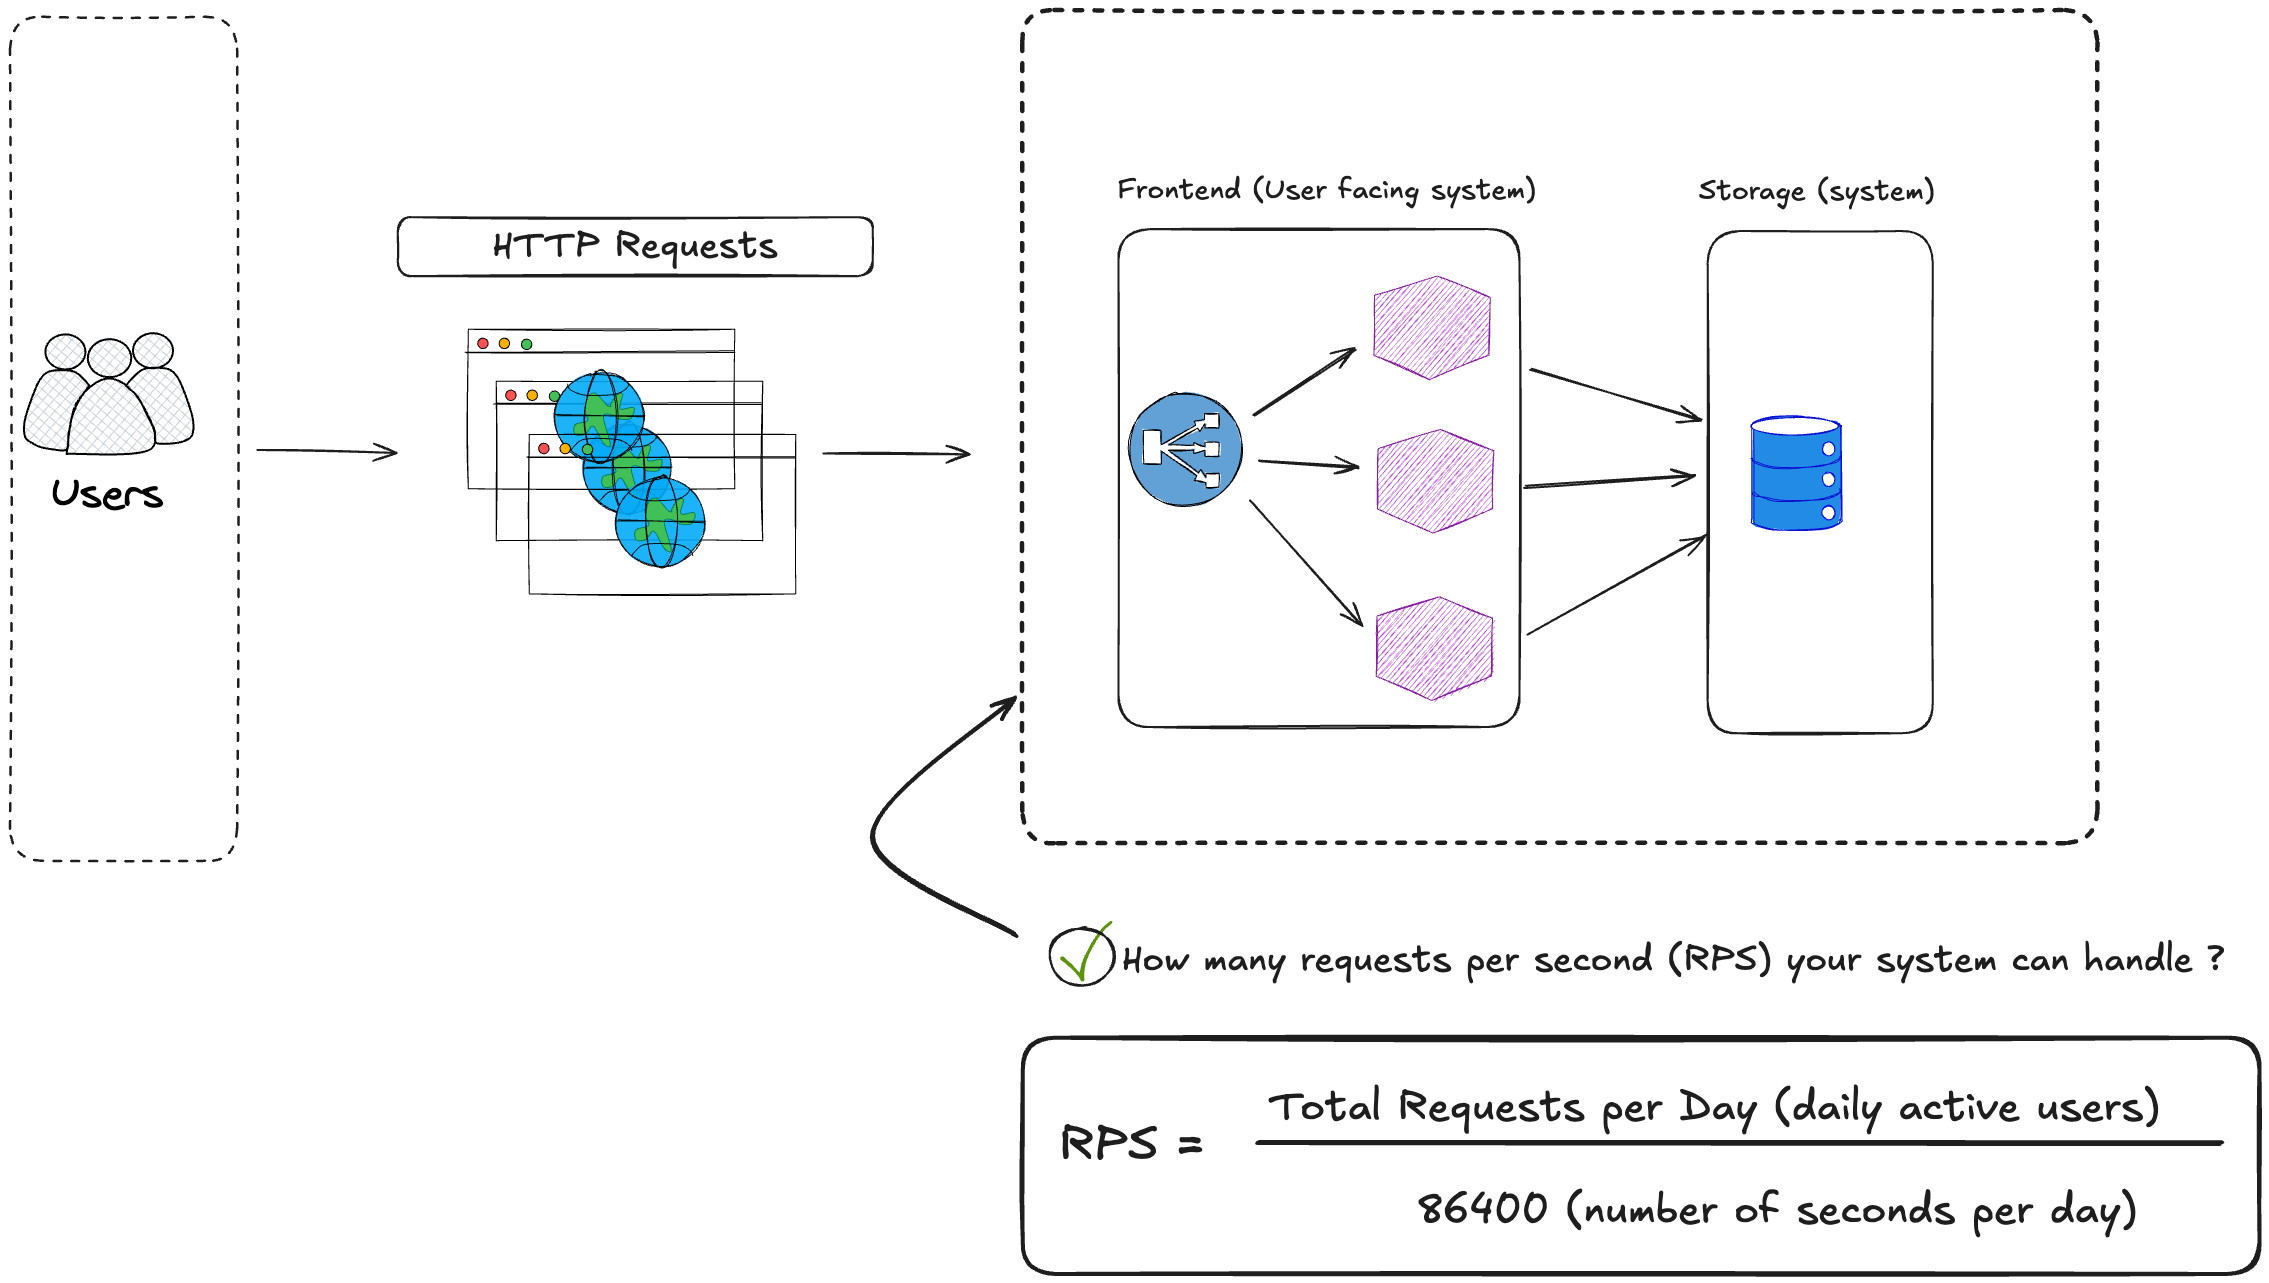
the number of requests or queries per/s (QPS) the system can handle (1 million requests/s, 5 millions requests/s)
Storage system
define whether the data is accessible.
the time it takes to read/write data (in terms of IOPS)
the ability to store information with no disruption, errors or failures.
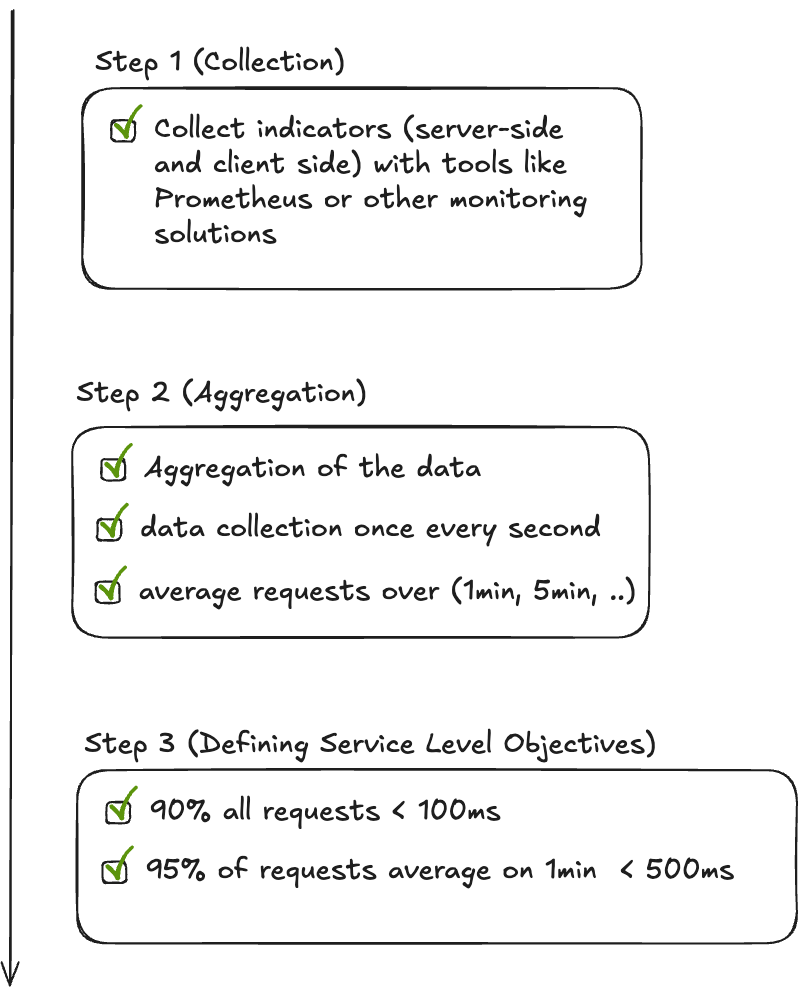
How to define the SLO ?
You can follow these 3 steps to define your service level objectives.
Eliminating Toil
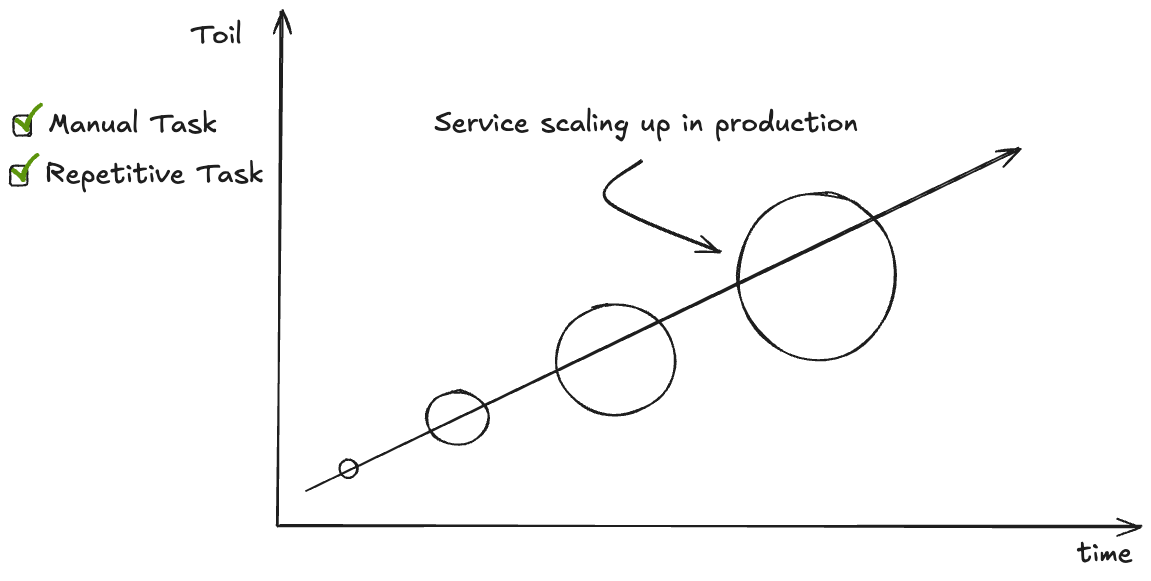
While running application in production, you may have to perform some operations: manual, repetitive, or automate; like running a script to automate some tasks, etc ;
The Toil represents basically the operations (cited above) that tend to increase exponentially as your service in production scales as illustrated in the following diagram.
Google approach is to allocate 50% of the time of SRE operations spent on reducing the toil, as illustrated in the following diagram :
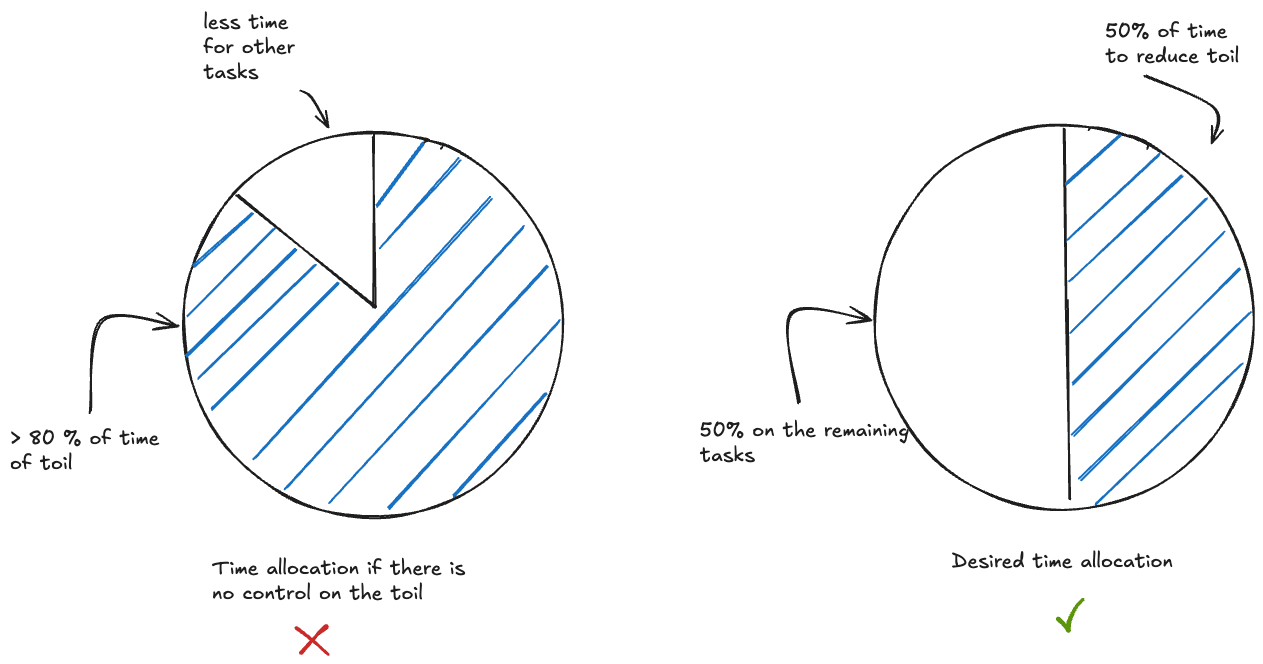
Time allocated to reduce toil, is like an investment on the future of your platform operations; Not allocating enough time on toil, can significantly increase the time you spend only on toil, reducing the time you allocate for other tasks (increasing delay for fixing issues, or developing features, etc..)
Monitoring Distributing Systems
Monitoring systems today get more and more complex. The old ways to conduct monitoring to get alerted if something breaks, do not apply to large distribution systems.
The evolution of software architecture (monolithic to microservices), has brought new challenges and to monitor efficiently these large scale distributed systems, there are few rules to adopt.
There are 4 crucial metrics to help you track how healthy is your system :
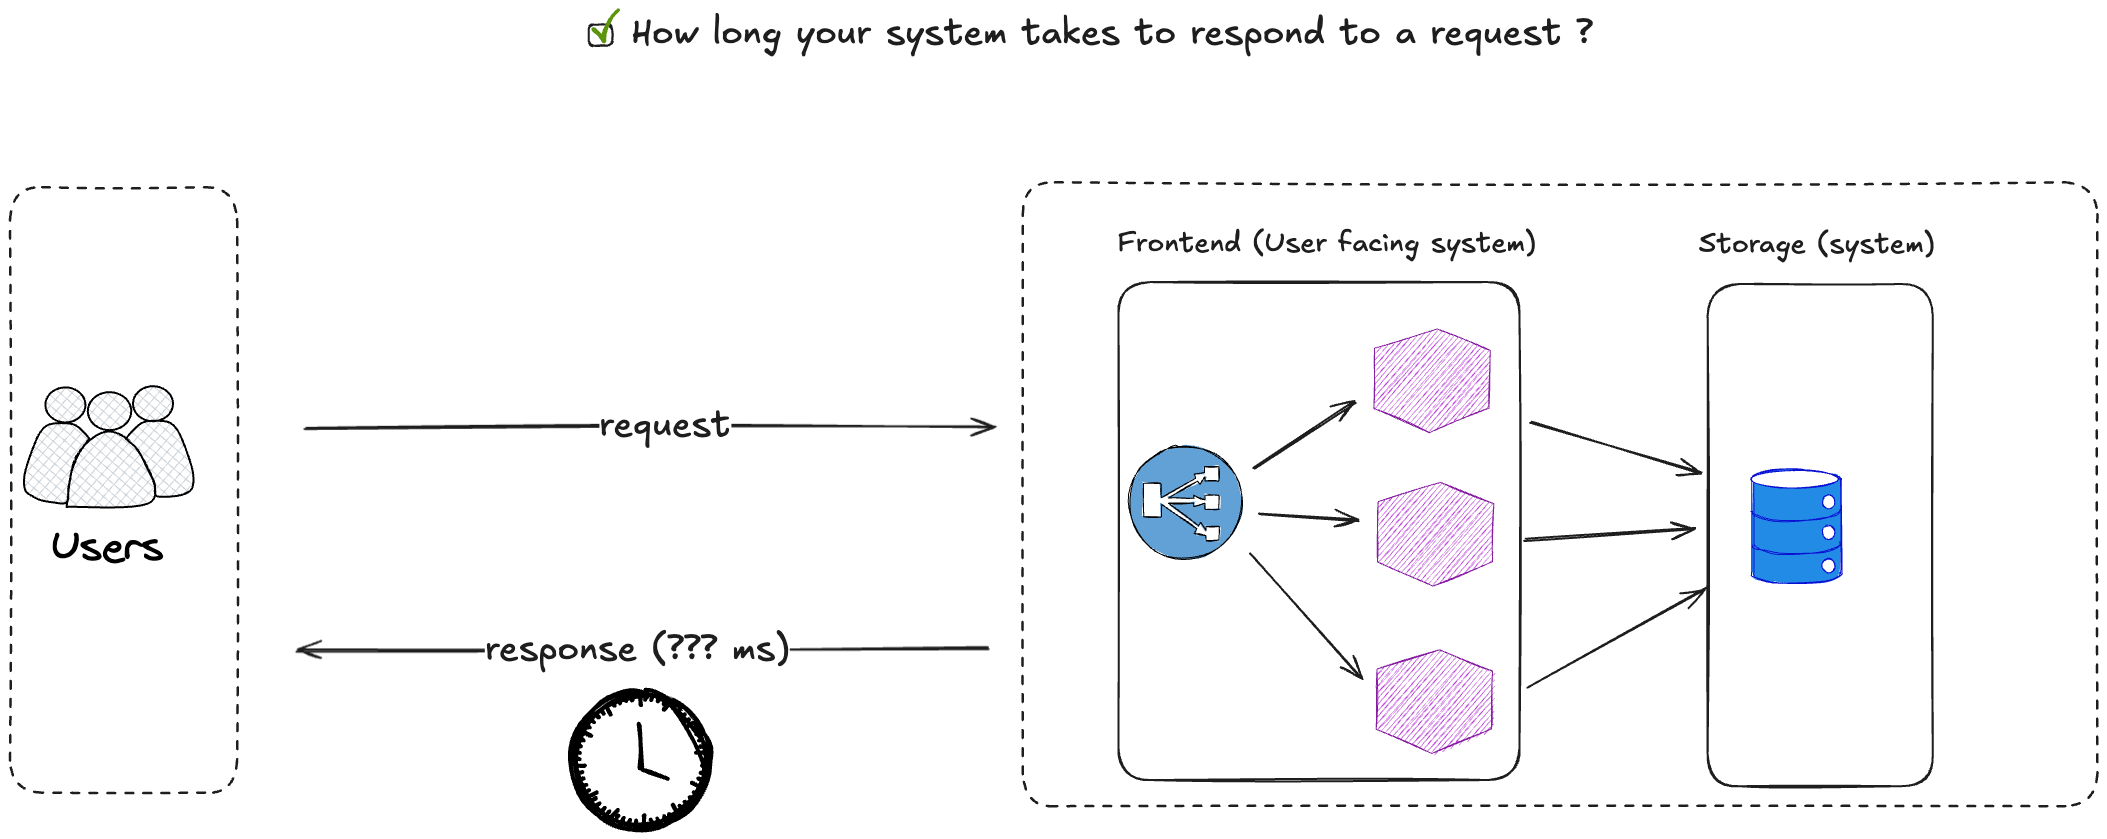
How long your system takes to respond to a request ? It's usually expressed in terms of milliseconds;
How many requests your system is handling? For instance for a web application it might be how many HTTP requests per second ?
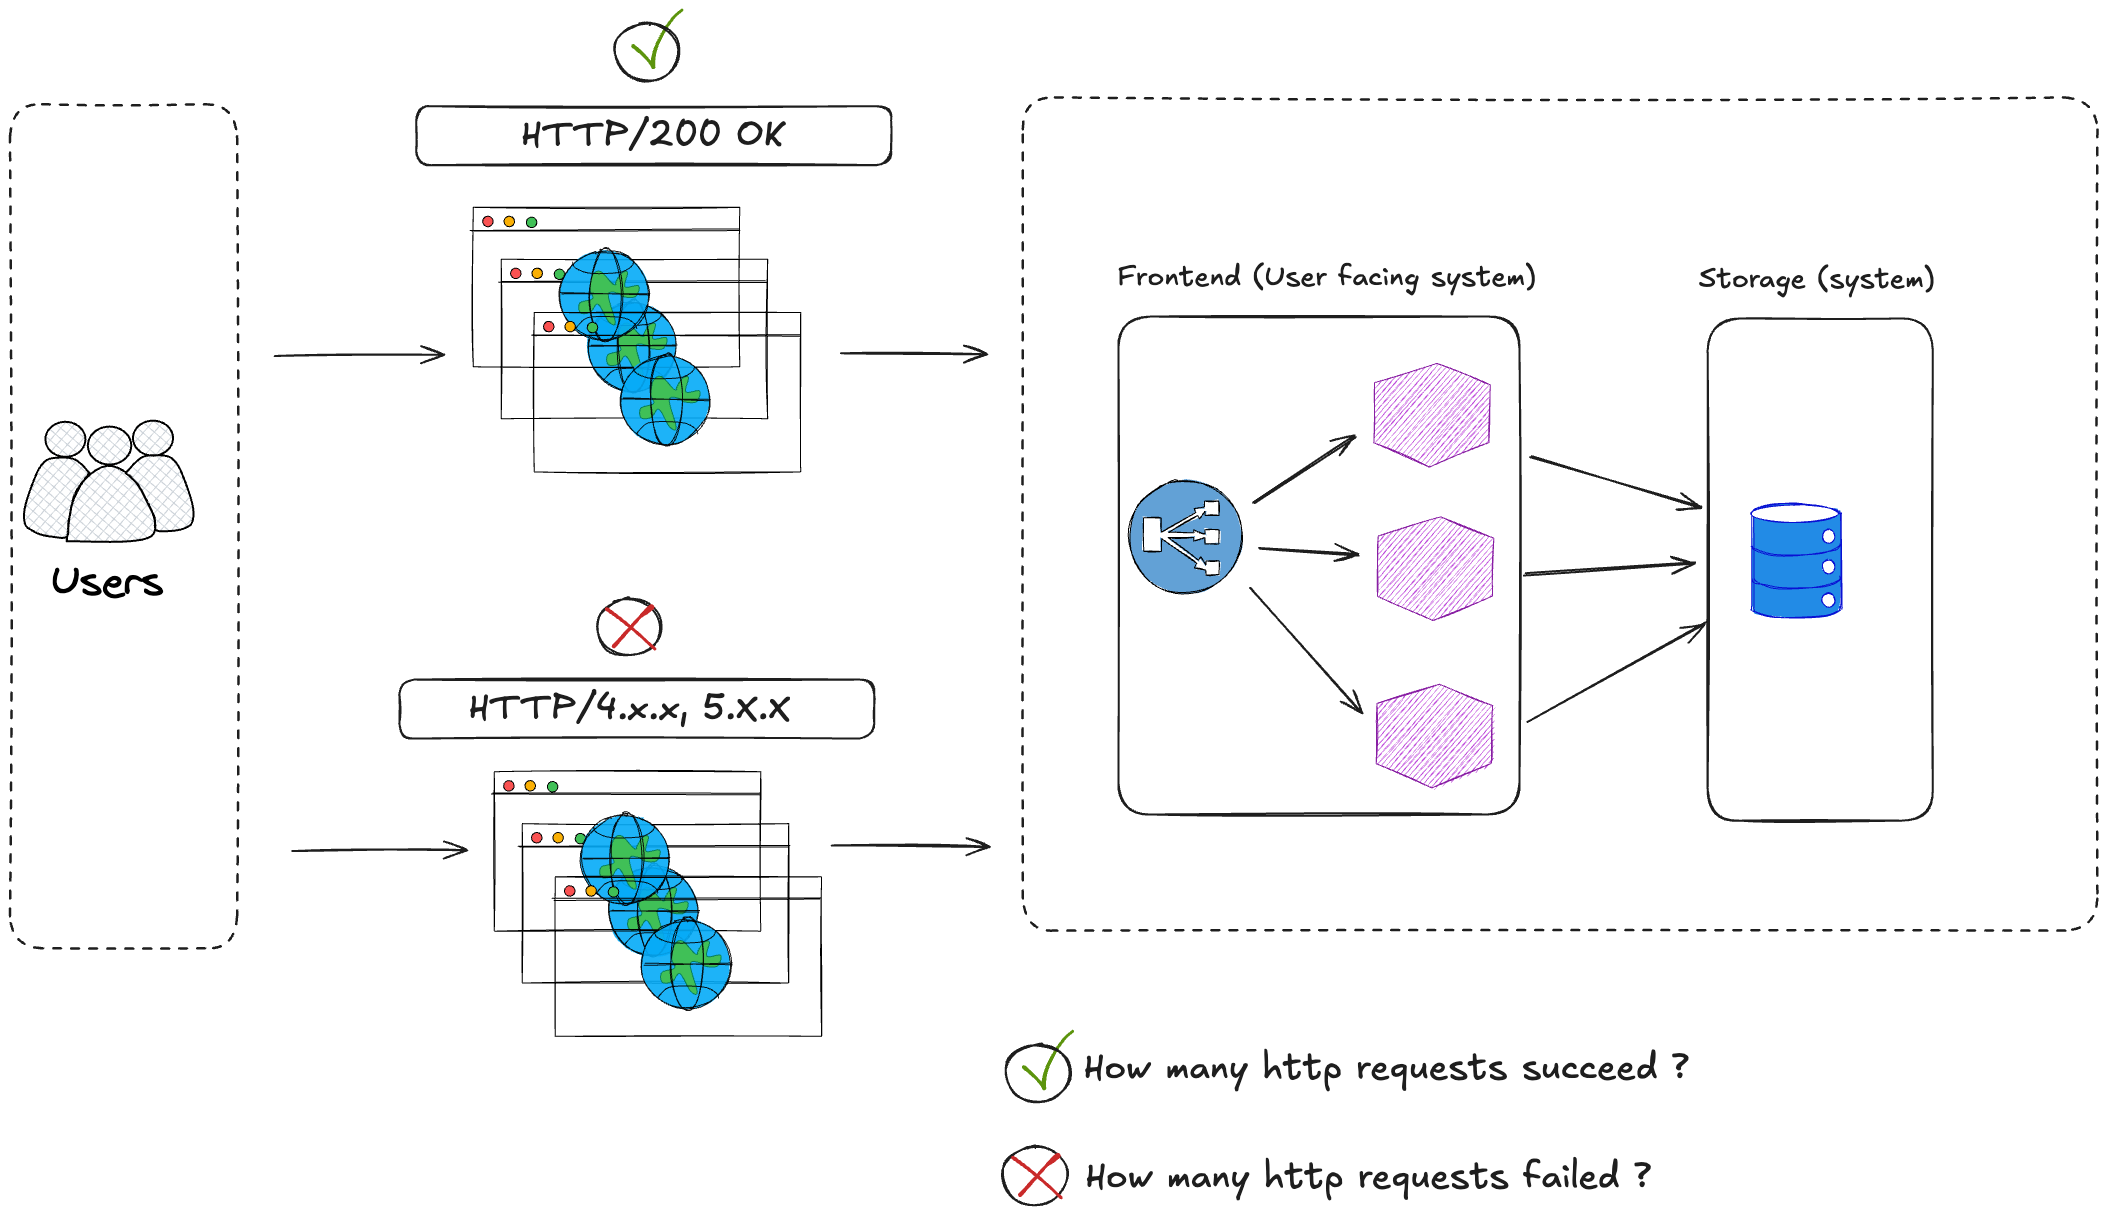
How many incoming requests fail ? How many HTTP errors (5xx, etc,..). This indicator can help you determine how reliable is your system.
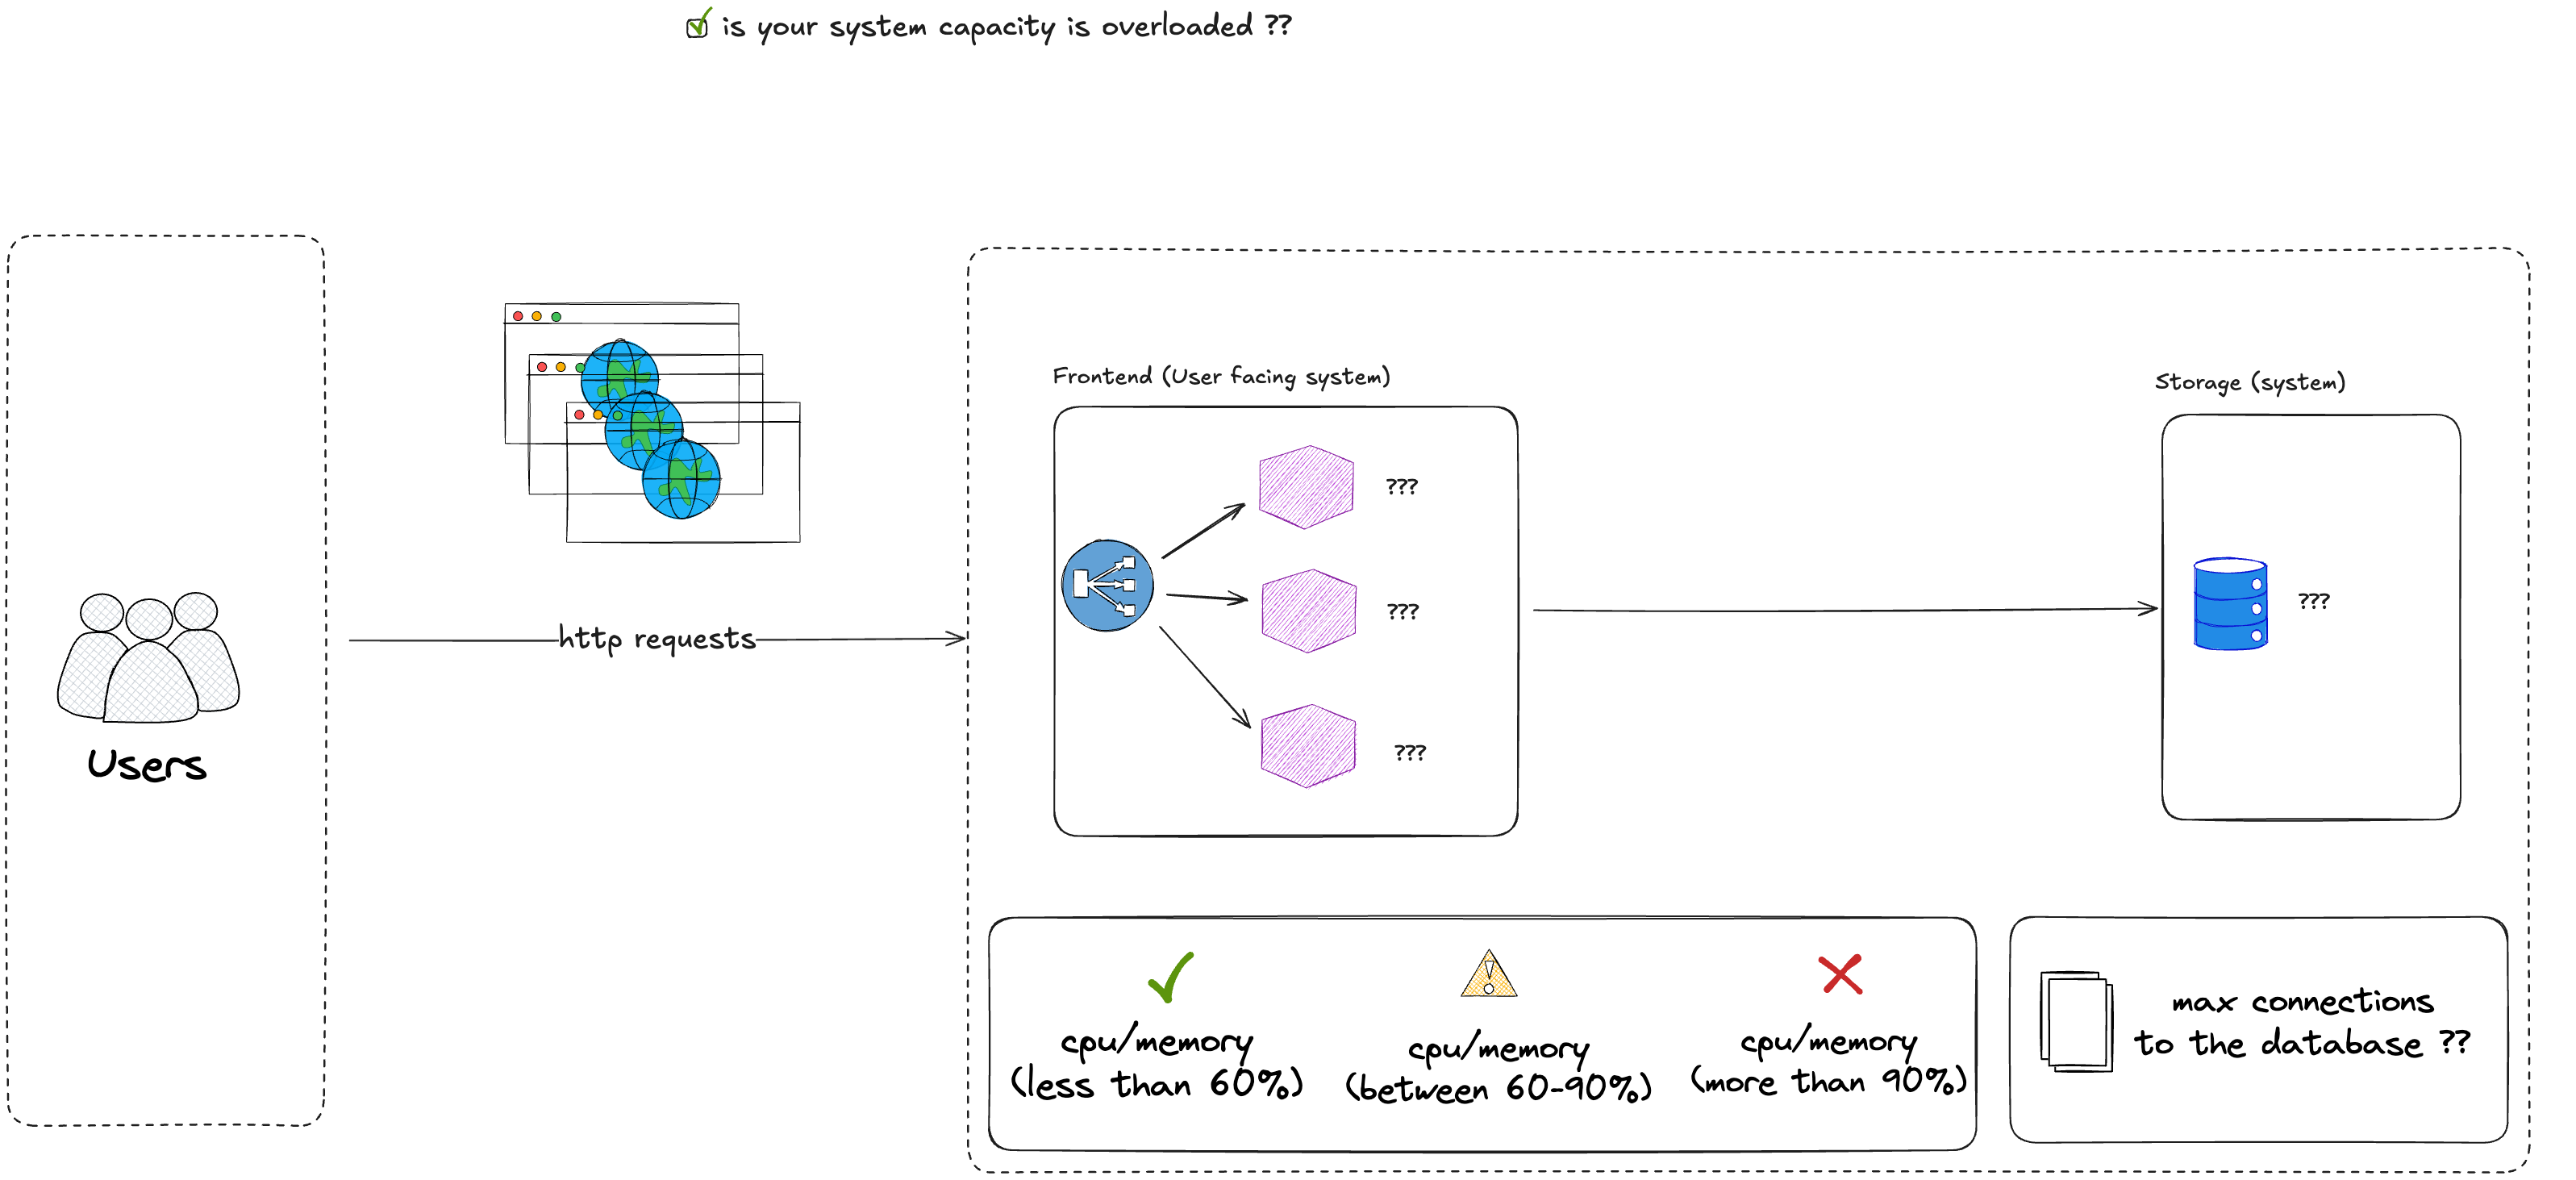
This indicator will determine if your system capacity is overloaded (max CPU, memory, disk consumption).
Some rules are important to keep in mind to maximize the effectiveness of an incident response, but also to prevent SRE teams to stay constantly under pressure.
Automate incident response as much as possible : You may receive several alerts for incidents that require the same manual resolution. Make a list of these incidents and make sure whether or not they are eligible for an automation (script or any other automated task) to prevent triggering unnecessarily your alerting system
Keep things simple : There is no reason to track a metric on everything. Some minor incidents not affecting the user experience or that may have lower impact on the service availability, might be removed from the alerting system. Your team receive several alerts, if there are too many of them in a short period, this might create fatigue.
Dashboards for what really matters : Too many indicators on your dashboard might be inefficient. Your dashboard should remain as simple and clear as possible to catch easily an incident, a pattern, a problem.
Top 10 Common Production Issues for SREs
SREs teams are facing many challenges in production. Here is a list of the common production issues :
| # | Issue | Real-World Example | Business Impact | Root Cause | Sources |
|---|---|---|---|---|---|
| 1 | Database Outages & Performance Degradation | Roblox (2021) – 3-day outage caused by Cassandra database scaling issues, affecting 50M+ users. | Multi-day downtime, lost engagement and revenue. | Schema migrations, runaway queries, replication lag. | Roblox Engineering Blog |
| 2 | Memory Leaks & Resource Exhaustion | Major e-commerce site – traffic spike caused Java memory leak; autoscaling couldn’t keep up. | Cascading failures, latency spikes, lost sales. | Unreleased object references in long-lived services. | |
| 3 | Unplanned Deployments / Bad Releases | AWS S3 (2017) – debugging command mistake triggered massive U.S. outage. | Thousands of websites went offline. | Bad rollout, lack of safeguards in deployment. | AWS Postmortem |
| 4 | Configuration Errors | Facebook (2021) – BGP misconfig cut off DNS servers, causing global 6-hour outage. | Billions in lost ad revenue, reputational damage. | Misconfigured network settings, YAML typos. | Meta Engineering Blog |
| 5 | Networking Issues | Cloudflare (2020) – router misconfig during backbone upgrade caused global traffic drops. | Service disruption across multiple regions. | DNS/routing misconfigurations, backbone changes. | Cloudflare Blog |
| 6 | Service Dependency Failures | Stripe/Twilio outages – caused cascading downtime for dependent services (payments, 2FA). | Customers unable to complete transactions. | Single points of failure in external dependencies. | Twilio Status Page, Stripe Status |
| 7 | Monitoring & Alerting Gaps | Fintech company – outage discovered only after Twitter complaints; missing API endpoint alerts. | Delayed detection increased downtime and losses. | Incomplete monitoring coverage. | |
| 8 | Scaling & Capacity Problems | Ticketmaster (2022) – crashed during Taylor Swift “Eras” tour presale due to demand surge. | Revenue loss, massive reputational backlash. | Underestimated load, misconfigured autoscaling. | Substack |
| 9 | Security Incidents & Certificate Expiry | Microsoft Teams (2021) – went down for hours due to expired SSL certificate. | Users unable to access business-critical service. | Certificate expiration monitoring gaps. | AppView Blog |
| 10 | Human Errors (Operational Mistakes) | GitLab (2017) – engineer accidentally deleted production DB directory. | Data loss, reputational damage. | Lack of guardrails for high-risk commands. | GitLab Blog |